

OM and BOV Engagement Benchmarks for CRE Brokers
What good looks like for offering memorandum and BOV performance — so you know whether your documents are working as hard as your deals deserve.
Key takeaways
- The average OM is opened 2.3 times per recipient; top-quartile OMs are opened 5 or more times by the same buyer.
- 68% of OM opens happen within 4 hours of send — same-day follow-up is the highest-leverage move in deal marketing.
- Buyers who reach page 3 or beyond in an OM are 4x more likely to make an offer or schedule a tour.
- BOVs sent to owners who requested them achieve 80%+ open rates; cold-sent prospecting BOVs run 45–60%.
- 25–35% of delivered BOVs result in a follow-up meeting within 2–8 weeks.
Why OM Engagement Metrics Matter
Most brokers send their OM and wait. They follow up in two or three days with a check-in email — "Just wanted to make sure you received the offering memorandum" — with no idea whether the recipient opened it once, read it cover to cover, or never clicked the link. That information gap is not just frustrating. It actively costs deals.
Engagement data changes the follow-up calculus at every step. A buyer who opened your OM four times in 48 hours is in a fundamentally different position than one who opened it once and has not been back. The four-time opener gets a call today. The one-time opener gets a softer follow-up email in 48 hours. Without open and page-depth data, you are applying the same follow-up strategy to contacts with completely different levels of interest — and burning goodwill with buyers who are not ready while losing the ones who are.
OM engagement tracking is not a luxury for brokers who have a lot of deals. It is the instrumentation that makes follow-up intelligent instead of arbitrary. The benchmarks in this section give you a baseline: what good engagement looks like across OM and BOV sends, segmented by context and format. Use them to diagnose whether your documents are landing, who is reading, and where you should be spending your follow-up time.
The practical implication: if you are sending OMs with no open tracking, your follow-up SOP is guesswork. Any platform that surfaces open data, page depth, and re-open counts gives you a signal that generic PDF sends never will.
OM Open and Engagement Benchmarks
The following benchmarks reflect observed patterns across CRE OM distribution on segmented, qualified buyer lists. Performance on cold or unsegmented sends will be lower across every metric.
Average OM opens per recipient: 2.3. Top-quartile OMs (deals generating real competitive interest): 5 or more opens from the same buyer. Multiple opens are the leading indicator of active evaluation — the buyer is returning to cross-reference financials, compare to another deal, or share the document internally.
Timing: 68% of OM opens happen within 4 hours of send. The first four hours after an OM goes out are the highest-leverage window for a follow-up call. Waiting two to three days to follow up means contacting buyers after they have already moved on mentally — the moment of peak interest has passed.
Page depth: Buyers who reach page 3 or beyond are 4x more likely to make an offer or schedule a tour compared to buyers who drop off on the cover or executive summary. This makes the first two pages of your OM the deal's most important real estate. If the investment thesis, the headline financials, and the market context are not compelling by page two, most buyers never get to the rent roll.
Download and open rate by list type: — Personalized, segmented buyer list (launch-day send): 35–50% open/download rate — Cold or unsegmented list: 10–15% open/download rate
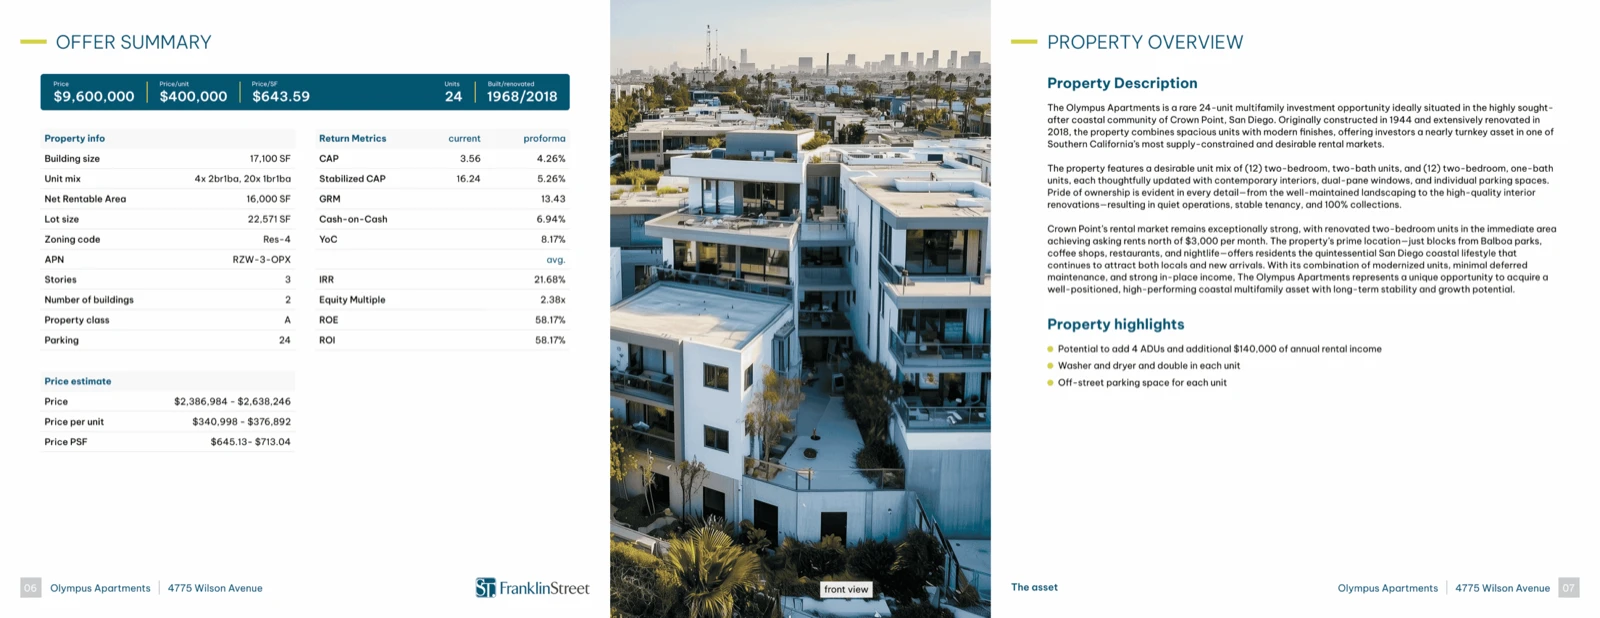
Format matters more than most brokers account for. PDF OMs are typically opened once and filed. Digital formats — listing websites, flipbooks, or tracked document links — are bookmarked and revisited as buyers move through their evaluation process. A buyer who returns to your digital OM on day 8 is telling you something a static PDF send will never show you.
Practical implication: track opens, watch for re-openers, and call within four hours. Those three behaviors alone separate the brokers who close on deal momentum from the ones who follow up when the moment has passed.
BOV Performance Benchmarks
BOVs outperform almost every other CRE marketing document on open rate — because they are inherently personalized to a specific owner and a specific property. A BOV is not a broadcast. It is a document the recipient either requested or is genuinely curious about because it references their asset. That context drives dramatically higher engagement than any general marketing email or OM blast.
Benchmarks by context:
BOVs sent to owners who requested them: 80%+ open rate. This is the warmest possible context — the owner asked for the valuation, they are expecting the document, and they are invested in what it says. An 80%+ open rate in this scenario is not impressive marketing. It is the floor for a relevant document sent to someone who is ready to read it.
BOVs cold-sent as prospecting tools: 45–60% open rate. This is where the BOV format earns its reputation as a prospecting weapon. A personalized, property-specific BOV sent cold to a property owner without a prior conversation still generates 45–60% open rates — far above standard cold email benchmarks — because the document is about their property. Owners are almost always curious about what their asset is worth, even if they have no immediate plans to sell.
BOV-to-listing-conversation conversion: 25–35% of delivered BOVs result in a follow-up meeting with the owner. That means one in three BOVs you send — whether requested or cold — leads to a real conversation. No other prospecting tactic in a broker's toolkit produces that kind of conversion rate at scale.
Time from BOV delivery to listing agreement: typically 2–8 weeks. BOVs rarely convert at first contact — owners need time to consider, consult advisors, and align with partners or family. The brokers who win the listing are the ones who stay present and credible during that window without being aggressive.
Practical implication: if you are not using cold BOVs as a prospecting tool, you are leaving a 45–60% open rate on the table on every owner outreach that currently starts with a generic email.
What Separates High-Engagement OMs from Ignored Ones
Two OMs on comparable deals — similar asset type, similar market, similar pricing — can produce dramatically different engagement outcomes based entirely on how they are structured. The gap is not design. It is content hierarchy.
Investment thesis in the first paragraph. The most common mistake in OM writing is leading with the property address, the asking price, and the building specs — data that tells a buyer what they already know or can find elsewhere. High-engagement OMs open with the investment case: why this asset, why now, why this market, what the buyer will have in 5 years that they do not have today. The thesis is what turns a passive skim into an engaged read.
Market context that demonstrates submarket expertise. Generic market data — "the metro area has 2.1 million square feet of industrial inventory" — signals nothing about the broker's knowledge of the specific submarket. High-engagement OMs include specific submarket data: vacancy rates by corridor, recent transactions with prices, demand drivers that are specific to this location. That context builds credibility and answers the buyer's first question: does this broker actually know this market?
Clean, scannable financials. Rent roll, T-12, and proforma on consecutive pages — not scattered across the document with narrative sections in between. Buyers evaluating multiple deals scan financials first. If they have to hunt for the numbers, they drop off before they get to the story.
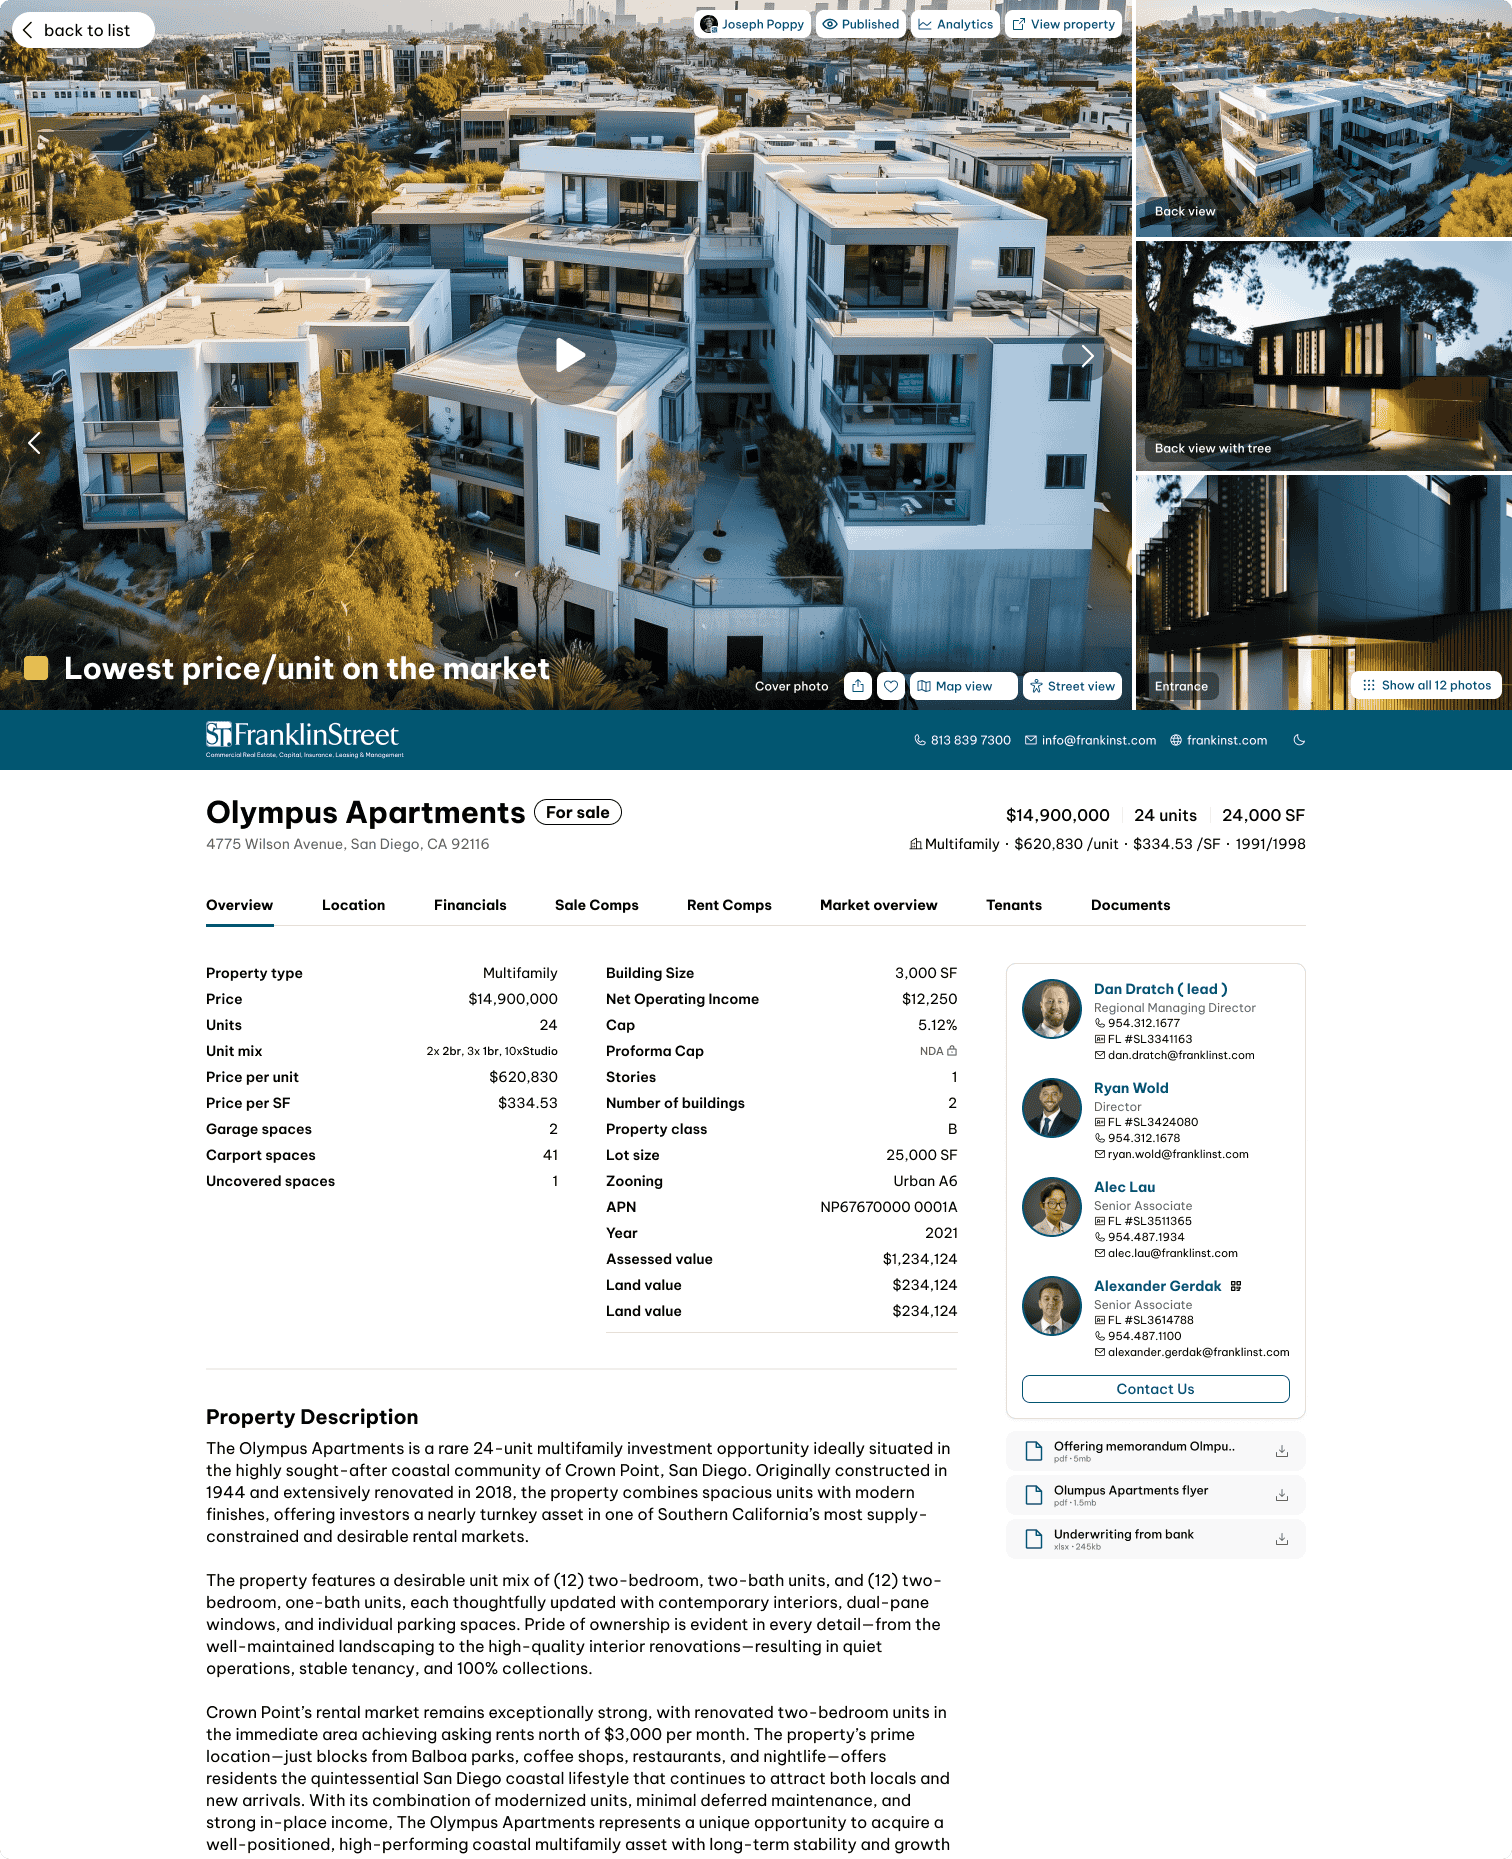
Listing website link for deeper engagement. An OM that includes a link to a listing website gives buyers a second path into the deal — one that is mobile-friendly, visually richer, and trackable. Buyers who click through to the listing website are signaling higher intent than those who stay in the PDF.
Practical implication: run your last OM against these four criteria. If your investment thesis is not in the first paragraph, rewrite the opening before your next send.
How to Track Your Own OM Performance
The benchmark data in this section is only useful if you have something to compare it to. Brokers who are sending OMs without tracking are operating without a feedback loop — and a feedback loop is what turns deal marketing into a skill that improves over time rather than a task that repeats at the same performance level indefinitely.
The tools for OM tracking fall into three categories. First, dedicated document analytics platforms: DocSend is the most widely used for CRE document tracking — it surfaces open counts, time spent on each page, and re-open activity by recipient. Digideck and similar platforms provide similar analytics for presentation-format OMs. Both give you the per-page engagement data that tells you exactly where buyers are dropping off.
Second, listing website analytics: if your OM links to a listing website, the site's analytics (Google Analytics or built-in platform data) will show you visit count, time on page, return visits, and click behavior. This is a blunter instrument than document-level analytics but valuable for measuring distribution effectiveness.
Third, integrated platform analytics: IntellCRE's platform includes engagement analytics on documents generated and distributed through the system, surfacing open and interaction data in the same workflow where the document was created. For brokers using a single platform for creation and distribution, this eliminates the need to layer a third-party tracking tool on top.
The three metrics to watch, in order of importance: re-open count (the leading indicator of active evaluation), page depth (the leading indicator of offer likelihood), and time-to-open (the follow-up timing signal). Set a follow-up SOP that triggers a call within four hours of any OM open from a tracked recipient. That single behavior change — following up on signal rather than on schedule — will produce a measurable improvement in tour request rate within 30 days.
Frequently asked questions
What is a realistic open rate for a listing launch OM email?
For a personalized email to a segmented, qualified buyer list, 35–50% open rate on launch day is a realistic benchmark. For a cold or unsegmented send, expect 10–15%. The gap between those two numbers is entirely a function of segmentation and personalization — the same document sent to the right list at the right moment dramatically outperforms a full-database blast.
How many OM opens should I expect from a typical qualified buyer?
The average across CRE OM distribution is 2.3 opens per recipient. Buyers who are actively evaluating the deal — running it up the chain internally or comparing it against other opportunities — typically open 5 or more times. Any recipient who opens more than 3 times is signaling active interest and should be prioritized for a direct call.
Are cold BOVs actually effective as a prospecting tool?
Yes — a 45–60% open rate on a cold, property-specific BOV is among the highest-performing prospecting touchpoints in a broker's toolkit. The reason is simple: a document that tells an owner what their property is worth will almost always get opened. The conversion to a listing conversation runs 25–35% of delivered BOVs, which means cold BOVs are one of the most efficient prospecting formats available.
Should I be sending PDF OMs or digital formats?
Digital formats — listing websites, tracked document links, or digital flipbooks — outperform static PDFs on re-engagement. A PDF gets opened once and filed. A tracked digital link shows you every return visit, and a listing website stays live and bookmarkable through the full buyer evaluation process. PDFs have their place for final document delivery, but as a distribution format for deal marketing, digital is measurably more effective.