

CRE Broker Marketing Benchmarks 2026
Data-backed performance benchmarks for email, LinkedIn, OM engagement, listing websites, and time-on-marketing — so you know exactly where you stand against your peers.
Key takeaways
- Personalized CRE email outreach to segmented lists achieves 35–45% open rates — nearly double the B2B average of 21%.
- Top-quartile brokers post on LinkedIn 3–5x per week and grow their following 4–6x faster than brokers who post once a week or less.
- 68% of OM opens happen within 4 hours of send — same-day follow-up is the single highest-leverage move in CRE deal marketing.
- Brokers using document automation tools report reclaiming 4–6 hours per week that goes back into prospecting and relationship management.
- The gap between top-quartile and median brokers is not talent or market access — it is systems.
Email Marketing Benchmarks for CRE Brokers
The B2B email average sits at 21% open rate. Personalized CRE outreach to a segmented, qualified list runs 35–45%. That spread is not a marginal edge — it is the difference between your listing launch email being read by one-in-five recipients or nearly one-in-two. Segmentation is the lever. Generic blasts to full databases perform like generic blasts always do.
Benchmark reference — listing launch emails:
Open rate — personalized, segmented list: 35–45% | Generic full-database blast: 18–22% Click-to-OM rate — launch-day email: 4–8% | Generic blast: 1–2% Reply rate — personalized outreach: 3–5% | Generic blast: under 1%
The stat that matters most for brokers is not open rate. It is reply rate. A 3–5% reply rate on a 100-person segmented list means 3–5 real conversations started per listing — before you make a single cold call. On a 250-person list, that is 7–12 conversations. Reply rate is the metric that connects your inbox to your pipeline.
Best send times, based on observed patterns across CRE marketing platforms: Tuesday through Thursday, 7–9am local time. Monday morning competes with the inbox backlog. Friday afternoons are dead. The Tuesday–Thursday morning window catches buyers and investors when they are at their desks, before their day fills with site tours and calls.
The practical implication: if you are sending listing launch emails to your full database unsegmented, you are burning your list and underselling your deal. Segment by property type, deal size, geography, and prior engagement. A tighter list with a personalized subject line will outperform a large blast on every metric that leads to a signed LOI.
LinkedIn Performance Benchmarks for CRE Brokers
The average CRE broker has 800–1,200 LinkedIn connections. Top performers in a given submarket — the broker who owns the industrial corridor or the net-lease strip — typically sit at 3,000–8,000. That network size gap compounds. More connections means more organic distribution on every post, which means more inbound, which means more deals sourced off-market.
Post frequency drives the gap faster than most brokers expect. Brokers posting 3–5 times per week grow their following 4–6x faster than those posting once a week or less. The algorithm rewards consistency, but the real mechanism is simpler: if you are posting daily, you are in your submarket's feed daily. You are the broker people think of when a deal surfaces.
Content type benchmarks — based on engagement patterns across CRE professional accounts:
Deal stories (closed transactions, case studies, before/after): 2–3x average engagement Opinion posts (market take, contrarian view, lessons from a deal): 3–4x average engagement Generic market updates ("Q4 vacancy is up 2%"): at or below average
The engagement metric that distinguishes real traction from vanity metrics is the comment-to-impression ratio. A ratio of 1% or above means your content is generating real conversations, not just passive scrolls. At 0.1–0.3%, you are getting views but not discussion — a signal to sharpen the point of view.
Personal pages consistently outperform company pages in CRE by 5–10x. Henry AI CEO Sammy Greenwall has approximately 8,800 LinkedIn followers; Lev CEO Yaakov Zar has approximately 18,000. Both drive significantly more reach through their personal pages than their company accounts. The same pattern holds at the broker level. Your name and your track record are the brand. Build those first.
Practical implication: if you post once or twice a month and wonder why LinkedIn is not producing inbound, frequency is the answer. Three posts per week — one deal story, one market take, one tactical observation — is a realistic starting point.
OM and BOV Engagement Benchmarks
Industry benchmarks suggest the average OM is opened 2.3 times by each recipient. Top-quartile OMs — meaning the deals that generate real competitive interest — are opened 5 or more times by the same buyer. Multiple opens from the same contact are the signal that separates a passive read from an active evaluation. If your deal marketing platform does not surface re-open data, you are flying without instrumentation.
Page depth is the other metric that predicts deal progression. Buyers who reach page 3 or beyond in an offering memorandum are 4x more likely to make an offer or schedule a tour than those who drop off on the cover or executive summary. This means the first two pages of your OM carry disproportionate weight — if the financials and the story do not land there, most readers never get to the rent roll.
Broker opinion of value benchmarks are strong when targeted: observed open rates exceed 80% when a BOV is sent directly to the property owner who requested it or when it specifically references their asset. A BOV is not a cold email — it is a document the recipient is already waiting for. The benchmark confirms what experienced brokers already know: the warmer the context, the higher the engagement.
Timing matters more than most brokers act on. Data across CRE marketing platforms indicates that 68% of OM opens happen within 4 hours of send. The window for a same-day follow-up call or email — while the document is fresh and the buyer's interest is highest — is narrow. Brokers who wait 2–3 days to follow up are following up after the moment has passed.
Format affects re-engagement. PDF OMs typically get opened once and filed or forgotten. Listing websites and digital flipbooks get bookmarked and revisited, particularly as buyers move through their evaluation process. The document format you choose affects not just first impressions but whether a buyer returns to your deal on day 5 or day 12 when their other options fall through.
Practical implication: set up open tracking on every OM you send, know your page-depth data, and call within four hours of an open.
Listing Website Performance Benchmarks
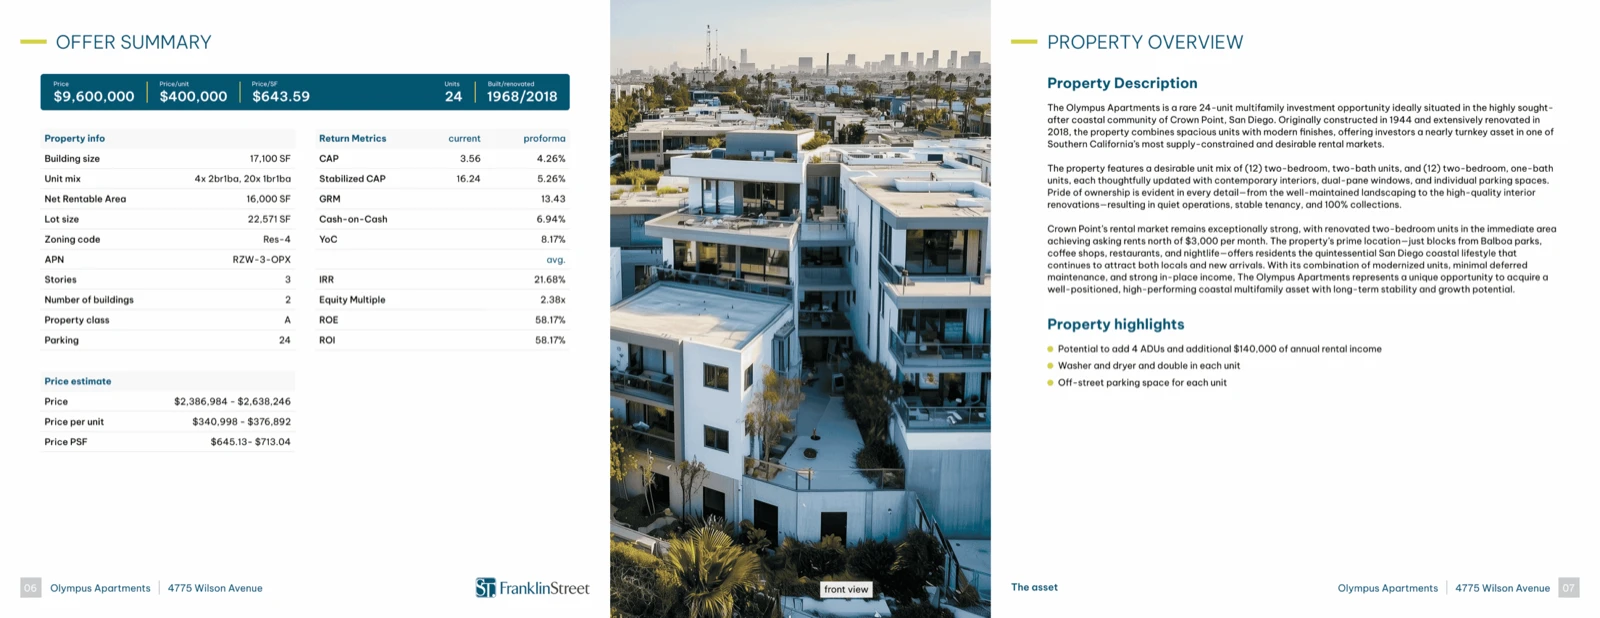
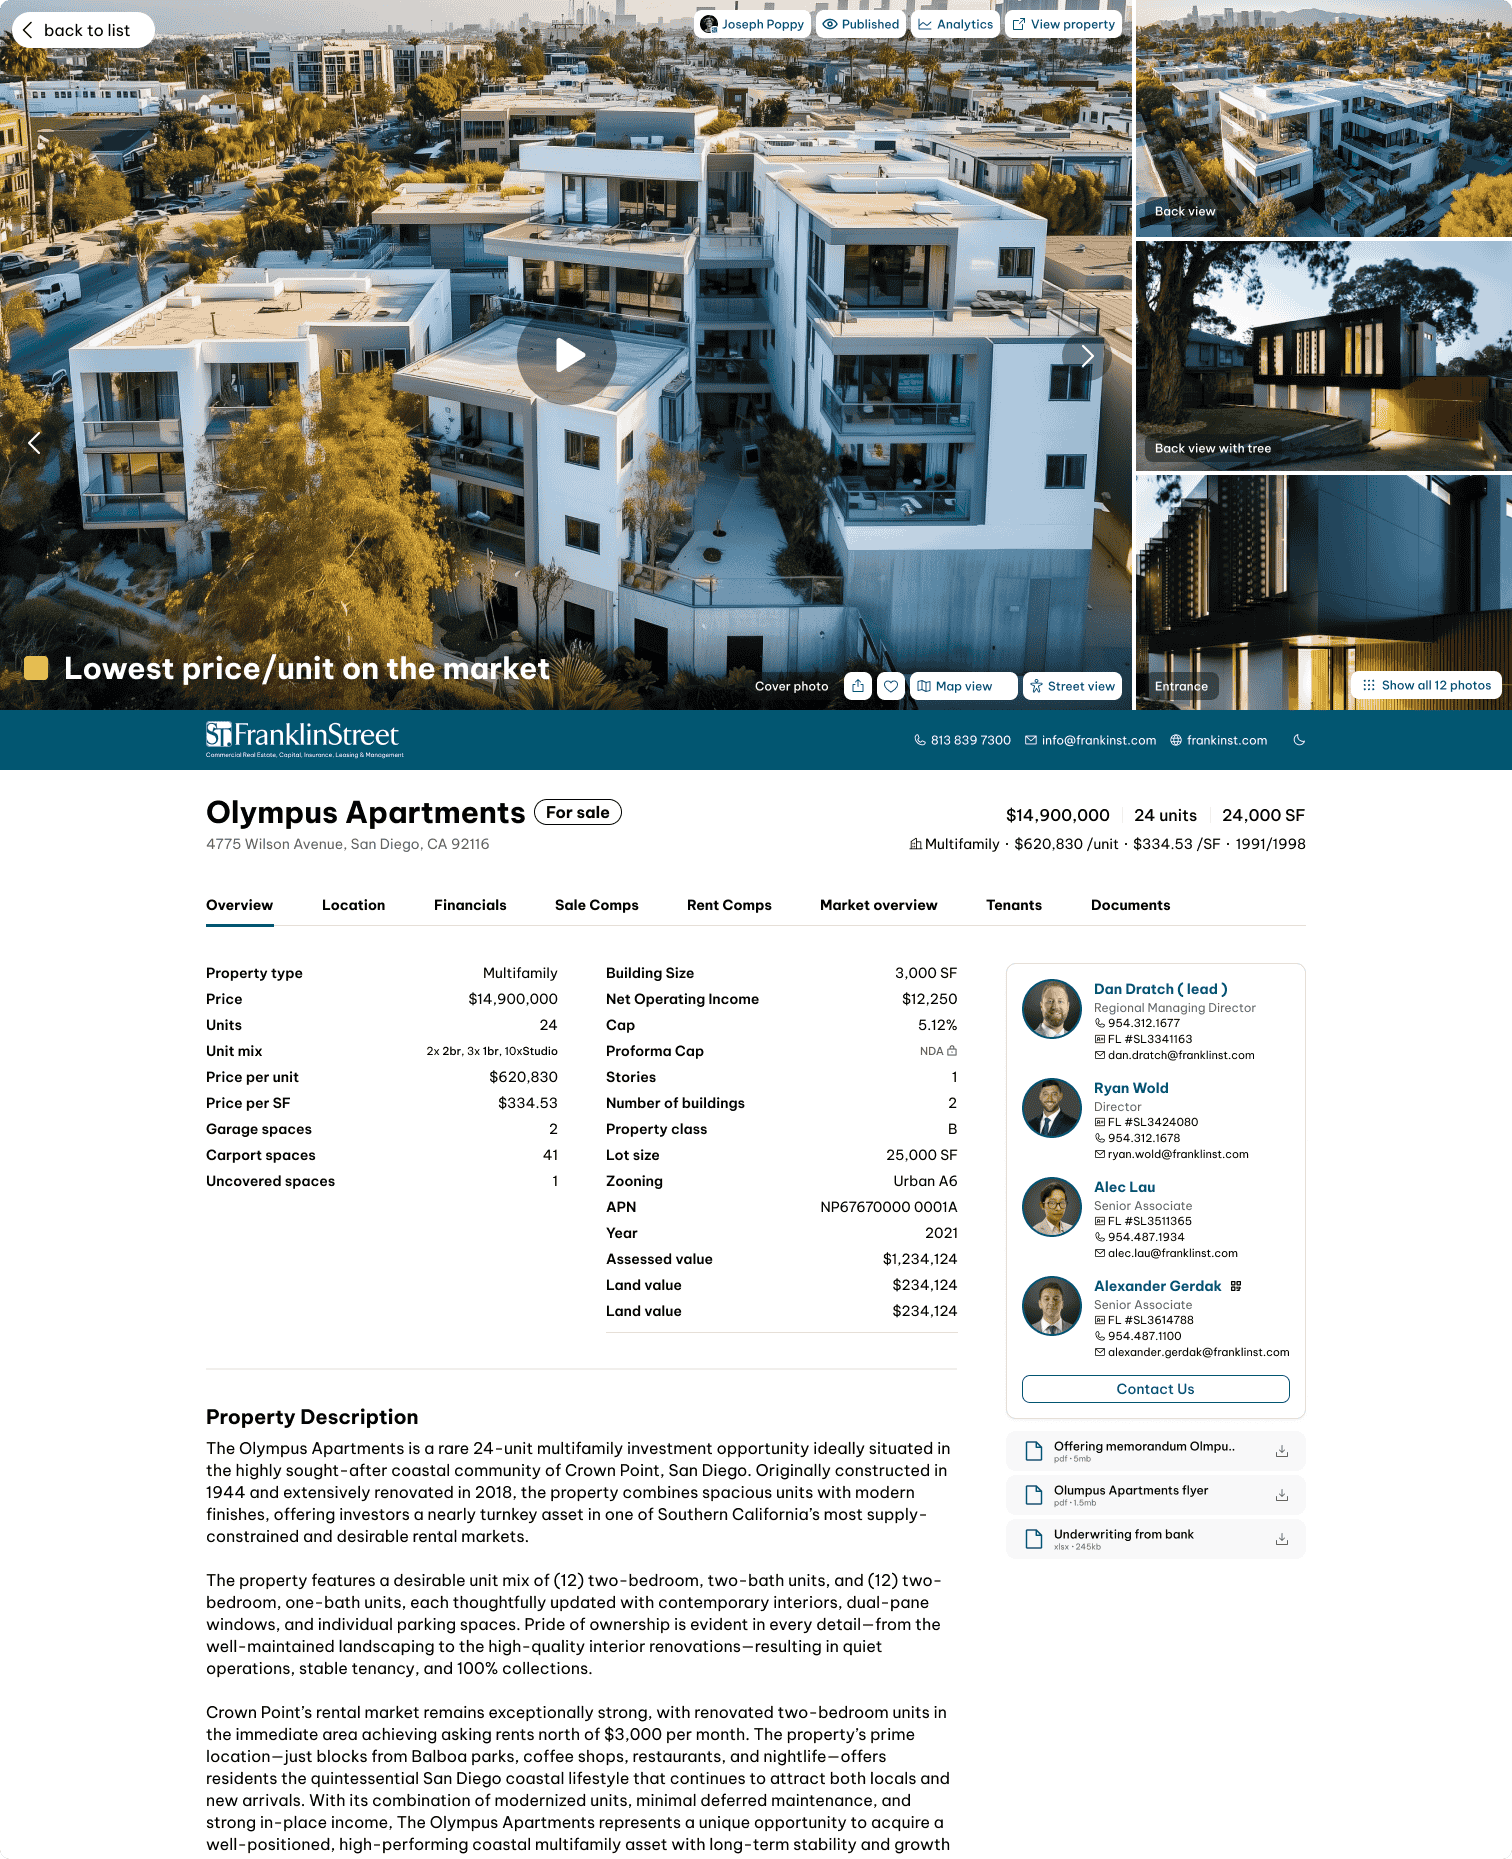
A well-distributed listing website for a commercial property — one supported by a targeted email blast, a LinkedIn post, and broker network outreach — generates 40–80 unique visitors in launch week. Underpromoted listings, where the website URL appears only in a PDF and never gets actively sent anywhere, see a fraction of that traffic regardless of the quality of the asset.
Traffic source breakdown for high-performing CRE listing websites:
Email referral: ~45% of visits Direct (link sent in a message or saved): ~25% Social media: ~20% Broker network referrals: ~10%
Email is still the dominant driver. Social amplifies it. Direct traffic reflects the buyers who bookmarked the page and came back — which is the behavior that precedes a tour request.
Tour conversion rates tell you whether your website is doing its job. Industry benchmarks suggest listing websites convert visitors to tour requests at 3–6%. Sites that include a video walkthrough — even a narrated drone pass or a 2-minute broker walkthrough — convert at 8–12%. A video does not just inform; it does pre-qualification work. Buyers who watch a full video walkthrough arrive at tours better prepared and further along in their evaluation.
Mobile traffic is the number you cannot ignore. Between 55–65% of listing website visits come from mobile devices. Broker marketing tools that are not mobile-optimized — small text, non-responsive layouts, PDFs that require pinch-to-zoom — lose more than half their audience before a single page loads cleanly. If your listing website does not work on a phone, it does not work.
Practical implication: if your listing website is getting fewer than 30 unique visitors in launch week, the distribution problem is upstream — not the site itself.
The Time Audit: Where Broker Marketing Hours Actually Go
The average broker spends 8–12 hours per week on marketing tasks. For a 50-hour work week, that is 16–24% of working hours spent on output — not on prospecting, not on tours, not on negotiations. The Time Tax is real, it is measurable, and it compounds across every listing.
Observed breakdown of broker marketing time:
OM and BOV creation: 3–4 hours per week Email writing and sending: 1.5–2 hours Social media (writing, posting, engaging): 1–2 hours Listing website setup: 1–2 hours Miscellaneous (formatting, coordinating with designers, revisions): ~1 hour
The biggest single time tax is OM and BOV creation — the task that sits at the intersection of the most hours and the highest stakes. A poorly executed OM costs deals. A well-executed OM takes four hours to build from scratch. Neither outcome is acceptable at scale.
Document automation has the highest measured ROI of any marketing tool in the broker's stack. Brokers using automation tools for OM and BOV generation report reclaiming 4–6 hours per week. That time does not disappear — it migrates to prospecting calls, site tours, and relationship touches. The compounding effect on pipeline is significant.
With IntellCRE, the same OM and BOV output generates in minutes instead of hours — intake form in, finished document out, ready to send the same morning you get the listing.
Practical implication: track your marketing hours for two weeks. The output will tell you exactly where automation would have the highest return on your time.
What Separates Top-Quartile Brokers from the Median
The performance gap between top-quartile brokers by transaction volume and median brokers in the same market is not talent. It is not market access. It is not who has the better Rolodex. It is systems — and the data on the specific behaviors makes that clear.
LinkedIn frequency: Top-quartile brokers post 3–5 times per week. Median brokers post 1–2 times per month. At those rates, the top-quartile broker publishes 150–260 posts per year. The median broker publishes 12–24. The visibility gap is not close.
Follow-up timing: Top-quartile brokers send a follow-up email or call within 4 hours of an OM open. Median brokers wait 2–3 days. Given that 68% of OM opens happen in the first four hours after send, waiting two days means following up after the buyer has mentally moved to the next item on their list.
Database management: Top-quartile brokers maintain a segmented buyer and investor database — categorized by property type, deal size, geography, and acquisition criteria. Median brokers send the same email to their full list regardless of the deal. The segmented list outperforms on reply rate, click rate, and conversion to tour requests across every benchmark in this report.
Automation adoption: Top-quartile brokers reclaim 4–6 hours per week through document and marketing automation. Median brokers do everything manually — and spend those same hours on OM formatting, email writing, and website setup instead of prospecting and relationship management.
The behavioral gap is actionable. Every item on that list is a practice that can be adopted within 30 days: posting schedule, follow-up SOP, database segmentation, automation tool. The brokers who close the gap fastest are not the ones who outwork the median — they are the ones who out-system them.
Practical implication: pick one variable from the list above, implement it this week, and measure for 30 days. Systems compound. Start one.
Frequently asked questions
How do I benchmark my own email performance?
Start with three metrics: open rate, click-to-OM rate, and reply rate. Open rate tells you if your subject line and sender reputation are working. Click rate tells you if the email body is compelling enough to drive action. Reply rate is the one that connects to your pipeline — 3–5% on a segmented 100-person list means 3–5 real conversations per listing. Most email platforms (Mailchimp, HubSpot, even Outlook with a tracking plugin) surface open and click data. Reply rate you track manually or with a CRM. Compare your numbers to the benchmarks in this report quarterly.
What is a realistic LinkedIn follower goal for a broker in year one of posting consistently?
Brokers who post 3–5 times per week and engage actively with comments typically grow from 500–1,000 connections to 2,000–4,000 followers within 12 months. The more important goal in year one is not follower count — it is inbound. One warm inbound inquiry per month that originates from a LinkedIn post is a meaningful result in the first year. Follower count is a lagging indicator of that. Focus on post frequency, deal stories, and direct replies to commenters. The following builds as a byproduct.
Should I track OM open rates, and how?
Yes — open tracking on OMs is one of the highest-leverage data points in deal marketing. You want to know who opened, when they opened, how many times, and how far into the document they read. Listing website platforms and digital OM tools (Buildout, Hightail, DocSend, or a listing website with analytics) provide this data. If you are sending a static PDF with no tracking, you have no follow-up signal. At minimum, embed a link to a tracked landing page in your PDF so you can see click activity even without full document analytics.
How do I know if my listing website is performing well?
Use the benchmarks in this report as your baseline: 40–80 unique visitors in launch week for a well-distributed listing, 3–6% conversion to tour requests (8–12% if you have video). If you are below 30 unique visitors in launch week, the problem is distribution — your email list, your LinkedIn reach, or both. If you are getting traffic but no tour requests, the problem is the site itself: unclear call-to-action, missing financials summary, or a layout that does not work on mobile. Traffic without conversion is a content problem. No traffic is a distribution problem.