

Using Tables in the IntellCRE Brochure Builder
Introduction to Table Modules
Hey everyone, welcome to this tutorial that is going to explain everything about tables, how you can use table modules, how you can build tables, how you can get data into tables in your brochures, and all the options you can use to customize and manipulate tables in the IntellCRE brochure builder and in the page builder.
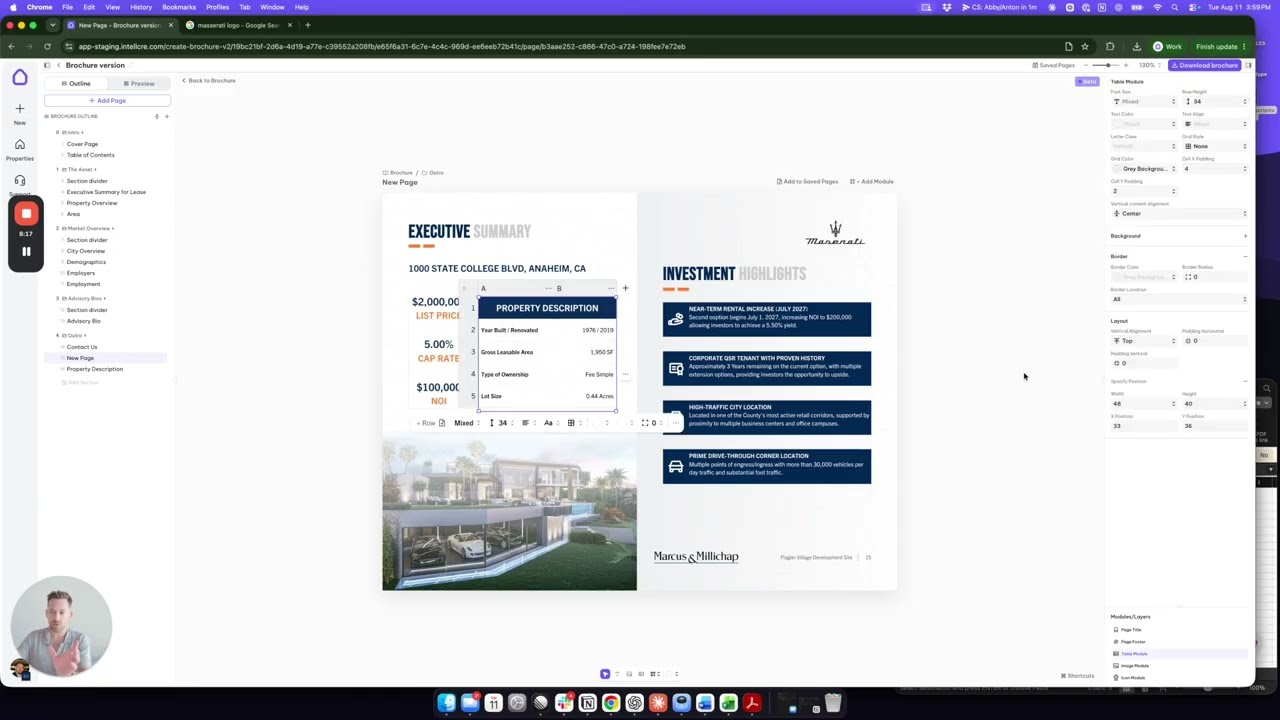
So first of all, to add a table to the page you’re building, you simply go to Add Module, select Table, and then you place the table somewhere on the grid, just like that.
You can resize it. Clicking on the corner, you can resize the table depending on your needs.
The table standardly comes with three columns, but you can always remove columns or add columns using the plus icon here.
It, by default, comes with one row, but you can add more rows by clicking this plus row icon.
Importing Data Into a Table
Before we actually start building our table here, let’s discuss what are all the ways we can create a table and how we can get data into the table.
One of the ways we can create a table page is we have certain financial data in a document that we’ve uploaded into our data room for this deal, or maybe we have the document — or sorry, the Excel file — on our computer.
We can actually start adding a page and choosing the Import Sheet option, and upload the document right here or choose the document that we already have in our data room.
Then we can choose the document and the precise spreadsheet that we want to import the data from.
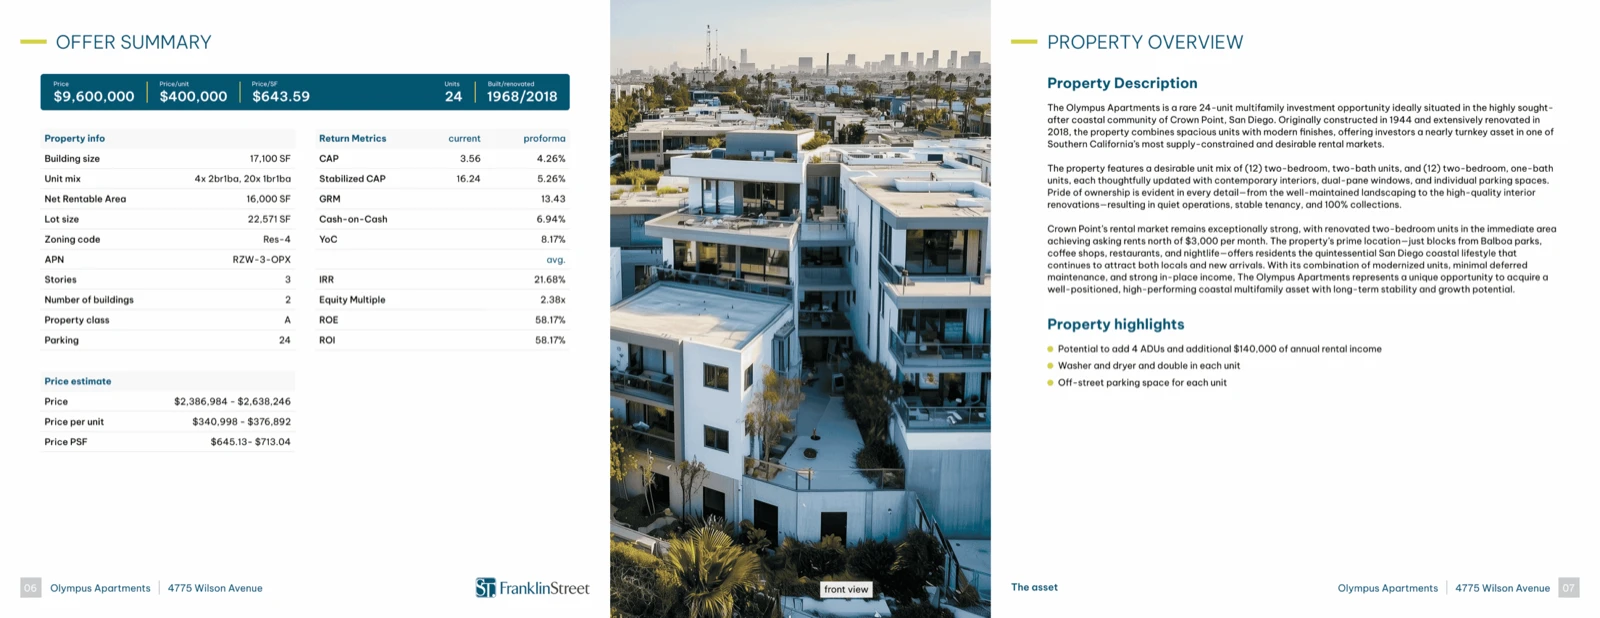
When we click, and this is something that we actually do when we are starting a new brochure version, as you can see, in this way we create a table page from the spreadsheet that is automatically formatted exactly how our original file is.
So this is our original file, and as you can see, the formatting here is preserved.
Then you can customize the table in all the ways that we’re going to explain in this video.
Importing Data Directly Into an Existing Table
The other method for including your data in the table is going to be directly as you’re building the table, using this icon next to the Add Row icon.
When we click this icon, this is a very similar process.
Here, I don’t have anything in the data room for this deal, as it is only an example deal.
But here you would see the documents that you already have in the data room.
You would be able to choose precisely which sheet contains the data that you want to import into this table.
Again, it would come imported with the same styles and formatting as in your original document.
Adding Data Manually or Copying From Excel
Once we have the table here, we have several controls.
Of course, there’s also another option, which is either typing in the data into the cells where it belongs or copying and pasting the data from any Excel document.
Let me show you how this works.
Imagine that I want to include this data into the table.
I’m going to select all these cells. I’m going to do Ctrl+C to copy.
Then I’m going to go into this table.
In fact, let me get rid of one of these rows to show you that actually, if there aren’t enough rows and columns, the system will automatically add them.
I’m going to go into this cell and do Ctrl+V.
And as you see, I copy-pasted the data here.
The system automatically created an extra row here for me to accommodate all the data.
Now I’m going to delete these rows and let’s look at some of the other options that we can use here.
Table Formatting and Styling
Obviously, we can format and style things per cell, or per selected text in a cell, or per column, or per row, or for the entire table.
Depending on what we select, if we just click the table now, we’re going to have all these options down here.
Also, on the right side, we see Table Module, and these are all the options that we can use for the table.
Things like fonts, size of the fonts, colors of the fonts, color of the background for the entire table, controlling the border of this table, alignment — whether it’s aligned to the left or right or centered.
The same for vertical alignment.
Row Height and Cell Alignment
Row height — how high these rows are.
Normally, the default is auto-fit.
Depending on the size of the fonts in the cells, the system automatically formats it.
As we can see, row number one is much higher than the remaining rows.
But we can start changing these heights per table or per row.
Same with alignment.
We can even select just a subset of the cells by clicking and dragging.
Now we can not only merge the cells and do operations as we are used to in Excel, but we can basically control the table selection.
We can play with things like X padding.
If we increase the X padding, the data is going to have padding from the left.
If we control the Y padding, the data is going to be getting vertical padding and things like that.
We can center to the top in the cells, or we can center to the center and things like that.
Text Alignment and Font Options
Let’s say we want to align this on the right.
We can basically choose the Align Right option, or center, or left.
All these options are there.
If I want to change the font of any specific cell, I can just select the cell or select the text.
Now I can make this bold or regular and things like that.
We can control this per cell, per row, as well as per column and the entire table.
Resizing Columns
If we need to resize the width of the rows, for instance, we can do it up here.
I can start resizing the width of the particular columns and things like that.
Those are all the options here that we can use.
Let me actually make the row height even bigger, or maybe even bigger like that.
Table Padding and Position
Once we are satisfied, we can also control the padding.
If we want to add padding on the left, for instance, and on the right, we want to do the paddings in the layout here.
If we want to add vertical padding, we can do the same.
Within that table module, we can control vertical alignment.
Whether the table is going to be basically aligned on the top or center and so on.
Here we have the width and height of the table that we can control manually.
We also see the X and Y position of the origin of the table.
Merging Cells and Creating Headers
We can merge cells.
These two cells are already merged.
The text there has a background here that is dark blue.
The text is bold, bigger, and the text color right here is set as white.
That’s how we achieve this header here.
Grid Options
Finally, we can reposition the table as we need.
Make sure that this is aligned with this other table.
The difference between these tables is subtle.
For instance, here we can also choose the grid.
If we have the grid and the color of the grid — grid color, you know, orange — now you will see we have an orange grid.
If we choose only the horizontal grid, we’re only going to have a horizontal grid, or just a vertical grid.
Finally, we can also do No Grid, or grid with basically a transparent color, to get rid of that grid completely.
We can control the grid options from here.
We can also control the corner radius of the outer grid.
Duplicating and Copying Tables
Finally, if you want to reuse this table, you can go to the three dots and duplicate.
You can also do this with any module or a group of modules.
Let’s say I want to copy this table and this table.
I’m going to click on the module.
Then I’m going to hold Shift and click on this module.
Now I’ve selected these two modules.
I’m going to do Ctrl+C and Ctrl+V.
Then I can place identical modules like that on the page.
I can also go to the three dots and simply delete these.
Those are the basic options for the tables that you can use to make beautiful tables in your brochure pages.
AI-Populated Tables Coming Soon
One important note is that with the new release, we’re going to be able to AI-populate any table in any saved page in any saved outline for you directly with the data from your data room.
Once that is released, basically you will be able to style your pages once, or our team will style your pages for you in the saved pages.
So all the tables that you’re going to need across all the pages in your brochure or document type, such as OM, BOV, or flyer, will be saved.
All these pages are going to be automatically populated with the data from various documents that are located in your documents for the property, so in your data room for the deal.
So, that’s that, and see you in the next tutorial.